Today:
- Return Exam 3
- Mean: 70
- StdDev: 20
- Curve: add 2.5 points to your total
- You can get 20% of your lost points by meeting with me to go over
your exam. For example, if you got a 60, you can get
.2*(100-60)=8 points by meeting to go over the exam.
- "Key"
- Quiz over the Chi-square distribution
- Quiz next time over sections 11.1/11.2
- Sections 11.1/11.2: Describing Relationships: Scatterplots and the Correlation Coefficient
- In contrast to chapter 12, where we attempted to determine if two
qualitative variables were dependent, in chapter 11 we look at the relationship
between two quantitative variables, and attempt to decide if it is
linear.
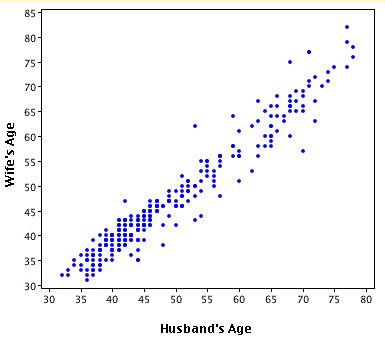
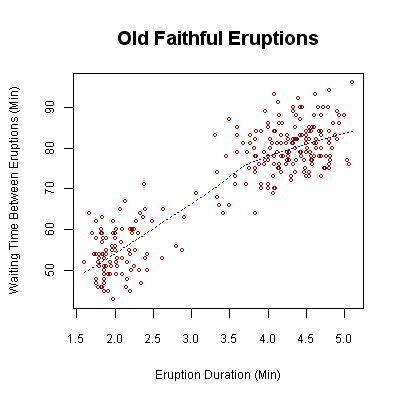
- We use a "scatterplot" to represent the two variables:


- Interpreting a scatterplot:

- positive linear relationship (as x increases, y increases)
- negative linear relationship (as x increases, y decreases)
- no linear relationship apparent
- Your conclusions should be drawn only for values of the
independent variable (X) between the limits of
the data values for X.
- Write your interpretation in terms of the variables of
interest, not "X" and "Y"
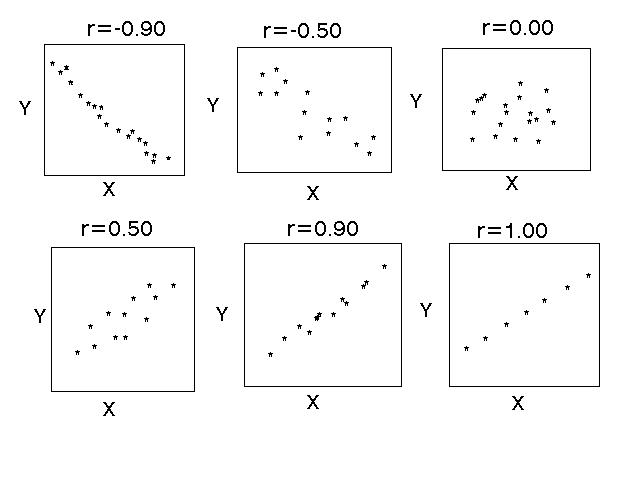
- We use the correlation coefficient (denoted "r") to
characterize the strength of the linear relationship:
- See the image above!
- Always between -1 and 1
-

- correlation coefficient test: A test for linear dependence of two
variables (p. 446)
Decision rule: Accept Ha if p-value <
Test Statistic:
where n is the number of pairs, and df=n-2.
- Conditions for using the test for correlation (p. 447)
- At each value of x, the distribution of the
y values in the population is normal, with
standard deviation independent of x (see Figure
11.5, p. 447)
- The sampled values of y are independent of one
another.
- Examples:
Links
Website maintained by Andy Long.
Comments appreciated.


