- In contrast to chapter 12, where we attempted to determine if two
qualitative variables were dependent, in chapter 11 we look at the relationship
between two quantitative variables, and attempt to decide if it is
linear.
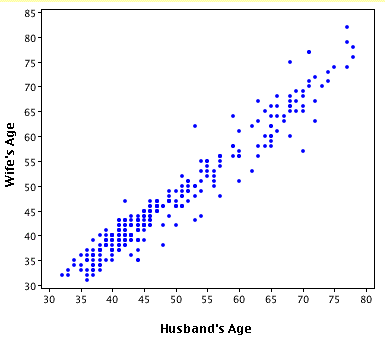
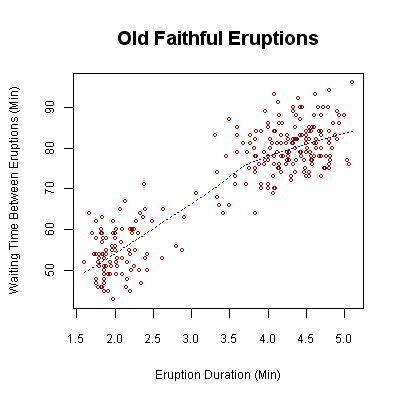
- We use a "scatterplot" to represent the two variables:


- Interpreting a scatterplot:

- positive linear relationship (as x increases, y increases)
- negative linear relationship (as x increases, y decreases)
- no linear relationship apparent
- Your conclusions should be drawn only for values of the independent variable (X) between the limits of the data values for X.
- Write your interpretation in terms of the variables of interest, not "X" and "Y"
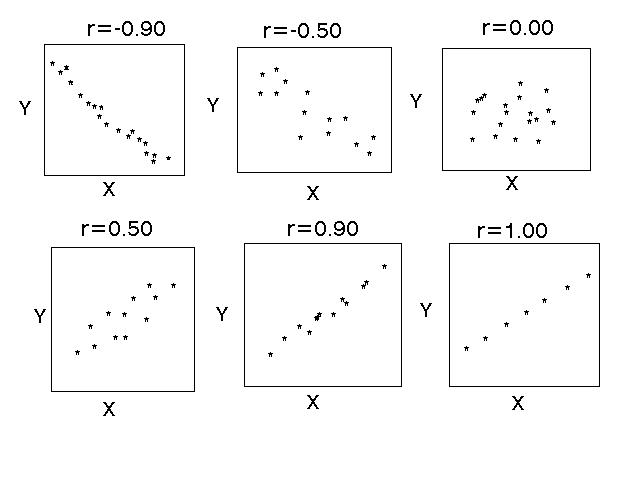
- We use the correlation coefficient (denoted "r") to
characterize the strength of the linear relationship:
- See the image above!
- Always between -1 and 1
-

- correlation coefficient test: A test for linear dependence of two
variables (p. 446)
Decision rule: Accept Ha if p-value < Test Statistic: where n is the number of pairs, and df=n-2. - Conditions for using the test for correlation (p. 447)
- At each value of x, the distribution of the y values in the population is normal, with standard deviation independent of x (see Figure 11.5, p. 447)
- The sampled values of y are independent of one another.
- Examples:
- The STA 205 CORRELATION AND REGRESSION EXAMPLE data:
http://www.nku.edu/~longa/classes/sta205/days/day28.txt
- Independent variables should give a "shotgun" appearance
to the scatterplot: example, two independent normal
variables.
- Let's look at the book example, Example 11.2, p. 437, in
StatCrunch:
http://www.nku.edu/~statistics/data/exam11-02.xls.
Is that relationship "not extremely strong"?
- Book exercise, #1, p. 444 and p. 451: http://www.nku.edu/~statistics/data/c11s01e01.xls
- The STA 205 CORRELATION AND REGRESSION EXAMPLE data:
http://www.nku.edu/~longa/classes/sta205/days/day28.txt
- If we decide that there is significant linear correlation between
two quantitative variables, then it makes sense to try to fit a
line to the data.
- Lines:
- are determined by two parameters: slope and intecept -- often written y = mx+b
- the parameters can be determined by two points on the
line: e.g. celsius and fahrenheit temperature scales.
- The slope measures the rate at which y changes as x changes. It's the change in y divided by the change in x.
- The intercept b is the value of y when x=0.
- In statistical parlance, the variable x is often called the predictor, and the y variable is often called the response.
- Linear regression/ least squares line
Fitting points to lines, in a "best way" Let's look at the VNP data from our worksheet with this applet
- Examples:
- Exercise #3, p. 461 (#1, p. 444, p. 451): http://www.nku.edu/~statistics/data/c11s01e01.xls
- Figure 11.4, p. 447 gives a good picture to guide us.
- The best point estimate of a response value for a give
predictor value is given by the line, but, as in the past, we often prefer a
confidence interval to a point estimate.
- The software gives two kinds of confidence intervals: a confidence
interval for the mean response
, and a confidence interval for a
response value y(x). The first is called the "CI" by
StatCrunch (for Confidence Interval), whereas the latter is
called the Prediction Interval, and hence denoted "PI".
- Example:
- Exercise #1, p. 470 (#3, p. 461; #1, p. 444, p. 451): http://www.nku.edu/~statistics/data/c11s01e01.xls
- Summary:
- If the objective is to estimate the mean value of y at a particular value of x, use the confidence interval.
- If the objective is to estimate a value of y at a particular value of x, use the prediction interval.
- Use these intervals only if a test of hypothesis indicates that the two variables are correlated.
- Use the linear regression results only within the range of the x values used in the regression: outside of those values, the behavior of y may change dramatically (there's no assurance that it continues to show a linear relationship).