- Your next homework is due Monday (trig identities and integrals)
- Homework 7.1 is returned:
- 6 -- we all make occasional algebra mistakes, but using
more space to do your problems will help you (and me!) to find
them. You are free to use recycled paper (e.g. the backs of
other pages). To make things a little simpler, choose
for your substitution.
- 38 -- The best u-substitution is
.
- 46 -- This is a case where you have to do IbyParts
twice. Again, algebra is a risk because there's so much of it.
Almost no one discussed the comparison of the plots. Why not?
- 6 -- we all make occasional algebra mistakes, but using
more space to do your problems will help you (and me!) to find
them. You are free to use recycled paper (e.g. the backs of
other pages). To make things a little simpler, choose
- Your test tomorrow will be through 7.1. You may use a scientific (but not graphing) calculator. You may not use a phone, or tablet, or any other type of calculator.
It seems clear to me that many of you aren't checking your answers with either a graphing calculator (e.g. TI-89) or Mathematica. I suggest the latter, because you can download my files and try these yourself. You can check your own work, and know what your objective is in integrating these.
This again represents a change in our course from the past, where we professors could assume that you each had the power to check your own work with a consistent calculator. But we now provide Mathematica, which is much more powerful. You need to take advantage of that!
- What's integration all about? Well, we usually start by going about calculating (signed) areas:
"dA" is called an "infinitesimal" -- it's a tiny chunk of area -- tinier than anything you know ("vanishingly small")!
What's numerical integration all about? We do pretty much the same thing, only we have
where the
are small, but not vanishingly small.
- There are various schemes for numerical integration:
- Left Rectangular
- Right Rectangular
- Midpoint
- Trapezoidal
- Simpson's rule.
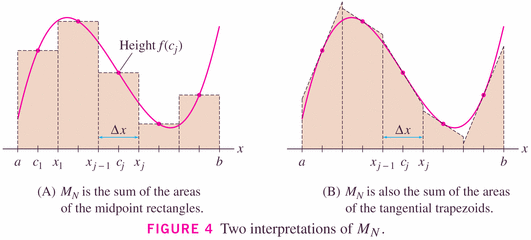
- Three of the rules are so called "rectangle rules" (LRR, RRR, Midpoint Rule);

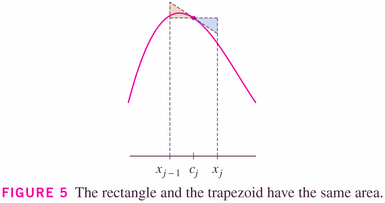
but as the image to the right (above) and the graphical insight below show, we can think of the Midpoint rule as being a "Tangent rule":

Be careful however not to confuse the midpoint and trapezoidal rule. The trapezoid represented above is not the same as the trapezoid of the trapezoidal rule.

- The Trapezoidal rule is really just the average of the LRR and RRRs. This gives rise to an important observation, which I want to encourage you to think about, and here it is:
When you have two estimates, you have a third. (their arithmetic average, in this case).

- Simpson's rule is a "blend" (or weighted average) of the Midpoint
and Trapezoidal rules, which perfectly balances the errors of the two
to generate a better rule:
Notice that the number of subintervals in Simpson's rule must be even.
Now we can go further:
When you have two estimates, you have infinitely many more. (their weighted arithmetic averages).

Here are the error bounds, that illustrate that the errors of midpoint and trapezoidal are related, and suggest how to combine them to create a better method (Simpson's rule):


- Here is a hand out which emphasizes this message. Let's take a look at this:
- Mathematica code
- Check midpoint calculation
- Let's do the calculations by the formulas, for
- Trapezoid
- Simpson's
- Check that we get the same things using the averages
- Calculate the true value of the integral, and compare to the approximations. What's surprising?
- Examples:
- #29, p. 541
- Others?
- Links:
- Here's a nice summary of the issue, focused on the use of Mathematica to illustrate them. Interesting even if you don't use Mathematica.
- Numerical Integration on-line.
Website maintained by Andy Long. Comments appreciated.