- Your 3.5 homework is returned: graded 13, 26, 44.
- Your 3.7 homework is due.
- Suppose that you clock your speed
at each minute along a 10-minute trip, in mph:
Estimate the distance travelled.minute 0 1 2 3 4 5 6 7 8 9 10 speed (mph) 0 30 45 30 70 65 70 70 45 30 35 Note that there are 11 speeds: your initial speed (0), and your speed as you "cross the finish line" (35), at the 10 minute mark.
- Dirt! Distance equals rate times time
$d=r*t$ - Assumes continuity of underlying speed function
- We might fit straight line segments between data points: this gives rise to the so-called "Trapezoidal rule".
- Other useful rules are rectangular: Left/Right/Midpoint rules:
- relax continuity! Use rectangles...
- also called rectangle rules: lrr, rrr
- Estimates:
Since each subinterval of time is the same (one minute), we can simply compute an "average speed", and then multiply by 10 minutes. The left-rectangle rule uses the left endpoints (and hence ignores the final speed); the right-rectangle rule ignores the first.
- LRR: d = 45.5*10 mph*minutes = 7.58 miles
- RRR: d = 49*10 mph*minutes = 8.17 miles
- Trapezoidal rule = 47.25*10 mph*minutes = 7.88 miles
- Notes:
-
- Whenever you have two estimates, you have a third:
- the trapezoidal rule is the average of left and right rectangle rules.
- Each of these estimates corresponds to computing a rectangle height (an
average speed), and then multiplying by the total time (10
minutes). Hence we're using the "dirt" formula, and computing the
average (the "area under the curve", even though there's no curve!) in
several different ways.
- Basically, every function can be used to create a table like this, and
then we can use these strategies.
- Example:
- Often (as in the table above) we have data located at equal intervals ($\Delta{x}$). When you have a curve (or a formula) for f, you can take the time
intervals shorter and shorter, until you get as close to the area as you
need:

(notice that $a+N\Delta{x=b}$ that is, that $\Delta{x}=\frac{b-a}{N}$)


Then, in fact,

- Examples:
- #1, p. 293
- Generalizations?
- The area can be calculated by finding an average value on the
interval, times the length of the interval:
Area under the graph of f from a to b = $\bar{f}(b-a)$ where by $\bar{f}\mbox{}$. we mean an average value of f. - The area can be calculated by chopping the interval [a,b]
up into smaller and smaller chunks, and then using rectangular approximations
to the small areas.
- In our work so far, the intervals into which the interval is chopped have been equal-sized: no reason to stick with that.
- If the size of the intervals goes to zero, then the approximations get better and better, until they're perfect!
- The area can be calculated by finding an average value on the
interval, times the length of the interval:
- Some more examples:
- Let's take a look at this Handout, and Stewart's animations.
- #6
- #15
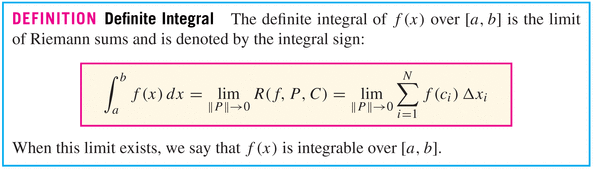
- section 4.2: The definite integral
- This section generalizes our intuition and examples from the preceding section:
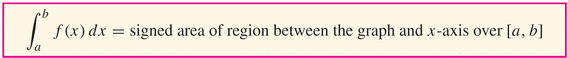
- First of all, we can't expect our function to be positive all the time, so
we define "signed area":

and then we give a name to this area:
- The area can be calculated by chopping the interval [a,b]
up into smaller and smaller chunks, and then using rectangular approximations
to the small areas.
- In our work so far, the intervals into which the interval
is chopped have been equal-sized: no reason to stick with that.
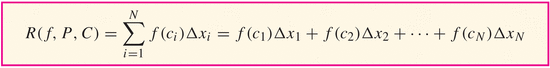
where P is a partition of the interval [a,b]:
$a=x_0 < x_1 < x_2 \ldots < x_N=b$ $c_i\in[x_{i-1},x_i]$ - If the size of the intervals goes to zero, then the
approximations get better and better, until they're perfect!
where
$\|P\|$ is the width of the largest subinterval,$max(\{\Delta{x_i}|i\in\{1,\ldots,N\}\})$ for the partition.
- In our work so far, the intervals into which the interval
is chopped have been equal-sized: no reason to stick with that.
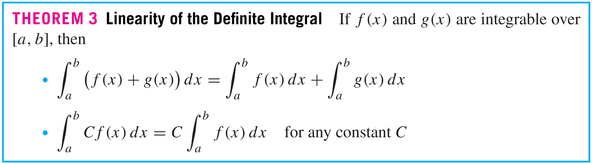
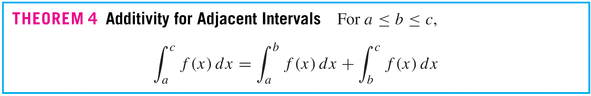
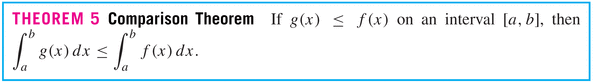
- Properties of the Definite Integral:
- Here's how we'd rewrite our generalization that
Area under the graph of f from a to b = $\bar{f}(b-a)$ :$\int_{a}^{b}f(x)dx=\bar{f}(b-a)$ where by$\bar{f}\mbox{}$ we mean an average value of f. - Examples:
- #7, p. 306
- #10
- #21
- #33
- First of all, we can't expect our function to be positive all the time, so
we define "signed area":
- This section generalizes our intuition and examples from the preceding section: