- This session will be captured on Zoom, if
I remember to turn it on, and record it. Please help me to remember.
I've created a page of the zooms and the play-by-plays.
- Roll (if I don't have a note card for you, let me know.)
- You have an assignment (to illustrate our Tree
Terminology page with your very own, beautiful
illustrations!). This is due Sunday night; that way I
can bring some to class on Monday and show them off
(he said, hopefully!). You'll submit those on Canvas
as pdfs.
I've had a couple of questions about this assignment:
- In the assignment I said "trees you've drawn yourself". I had someone create a beautiful tree on the computer. If you create your own beautiful digital trees, I'm good with that; but don't just download some trees....
- Don't forget that you need to illustrate all the terms on the page. You can't do them with the same tree, because some concepts are mutually exclusive.
- Today I'm giving your first IMath homework, which will cover the
material we've done so far.
You're going to need to do the following: visit imath.nku.edu, and
- Create an account (if you don't already have one); then "Enroll in a new class" with this info:
- Course ID:
- Section 002 (in-person): 493
- Section 003 (on-line): 495
- Enrollment Key: 3.1415
- On a very sad, and timely reminder of the importance of testing,
the climate scientist Lisa
Goddard has died, age 55, and the cause was breast cancer....

Ironically, I learned it just moments after doing the play-by-play for this discussion of breast cancer. Argh....
- This material concludes our "Covid unit": we'll be moving into the
world of numbers next week, starting with counting! The great
news is that our first assignment is straight out of Sesame
Street....
So you'll have a reading to do.
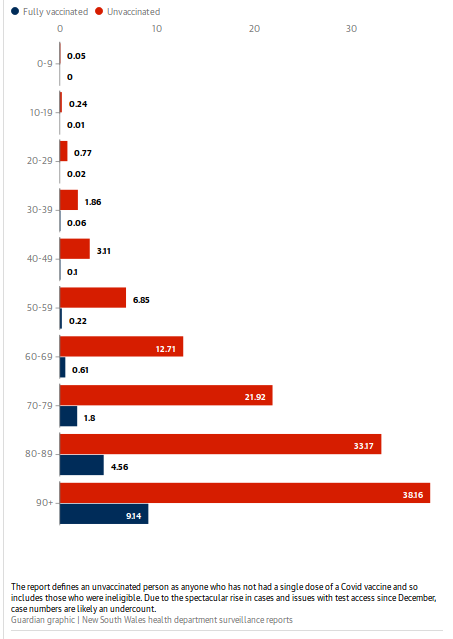
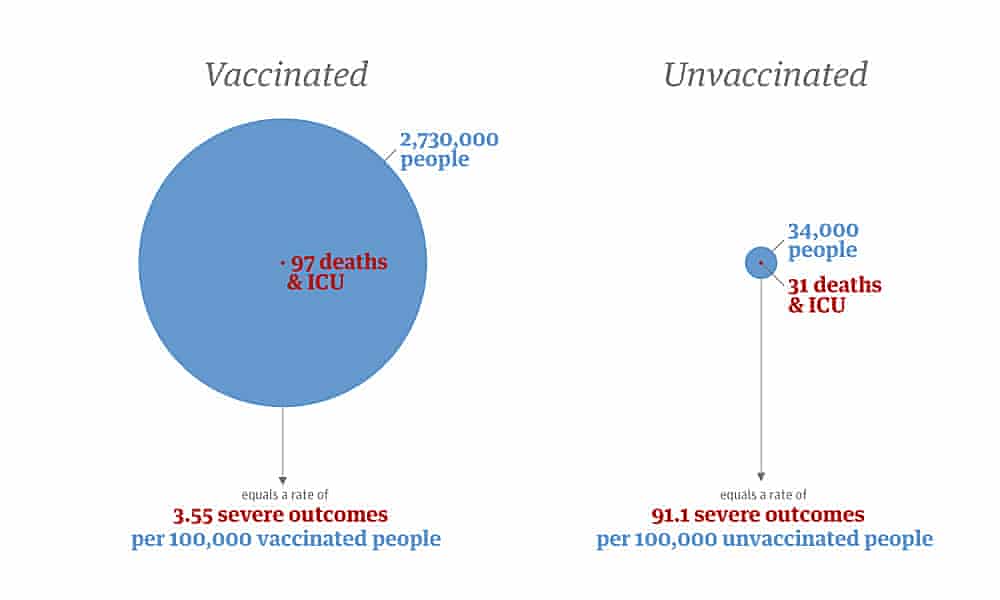
I'd like to end things on a story that came out today from New South Wales, Australia on the relationship between vaccination status and severe outcomes with Covid.

People in my cohort are 25 times more likely to have a severely negative outcome (death or ICU) if they are unvaccinated.
We can build a binary tree using the data provided to see what the results are overall. It's all contained in one figure.
- We studied a fairly mathematically intense subject:
probability. Yet, with the help of perfect, binary
trees, and with Strogatz's students' idea of "natural
frequencies", we are able to solve some interesting problems
fairly easily.
- Let's review the breast cancer case.
- Today we're going to have a look at Covid testing.
In particular we're going to focus a bit on the two types of errors we make: false positives, and false negatives.
- While hunting around for data on those two types of errors for
Covid, I stumbled upon this Covid Testing
calculator -- which is exactly what we've been talking
about. Maybe they read Strogatz's book....:)
Except it's organized in a different way: so let me show you how to relate it to our trees.
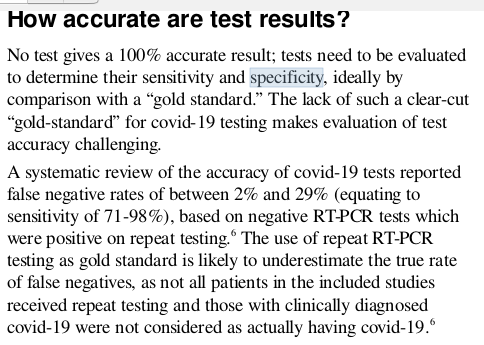
The first thing is to understand their vocabulary. While we both talk about "false positives" and "false negatives", they add "sensitivity" and "specificity" into the mix.
Our perfect, binary trees of depth two have four leaves. Each of these leaves can be given a name: "false positives", "false negatives", "true positives", and "true negatives".
But they've laid their calculator out like a table:
B+ B- T+ True positive False positive T- False negative True negative \[ sensitivity = \frac{\textrm{true positive}}{\textrm{true positive + false negative}} \] and \[ specificity = \frac{\textrm{true negative}}{\textrm{true negative + false positive}} \]
- There's a paper associated with that tool (British Medical Journal, May, 2020), in which they claim that

- We'll see that we can actually use this tool to check our work
from last time:
- Plant problem:
- "disease prevalence" (water forgotten): 30%
- "positive test" (death):
sensitivity (death given forgotten) = 90% - "negative test" (alive):
specificity (alive given watered) = 80%
- Breast cancer problem (problem: only 100 in the cohort on this tool
-- that is a bit of a problem, but you'll see the "ghost" of
our solution!):
- disease prevalence: 0.8%
- sensitivity (test positive given disease positive): 90%
- specificity (test negative given disease negative): 93%
- Plant problem:
- Now, on to actual Covid numbers. We're going to use data from
Cornell.
As usual, we're going to start by drawing some pictures of the situations -- the trees.
- Now, to the crucial question of the day: you've gotten
the news that you tested positive for Covid. Do you
really have it?
- We'll use data from Cornell University, which was
published yesterday in the Cornell
Chronicle. They said that they are seeing a
"positivity rate" of around 2%.
That's actually includes all positives, of course, including those who are actually false positives.
Let's assume that there are is a cohort of 1000 Cornell undergraduate students, and that the Covid rate is 2%. We'll use "sensitivity=.70" and "specificity=.95" that the authors of the BMJ article used.
Now we'll build our tree, and answer the question of the day:
- If my test is positive: what's the chance I really have it?
- If my test is negative: what's the chance I really have it?
- Now, to the crucial question of the day: you've gotten
the news that you tested positive for Covid. Do you
really have it?
