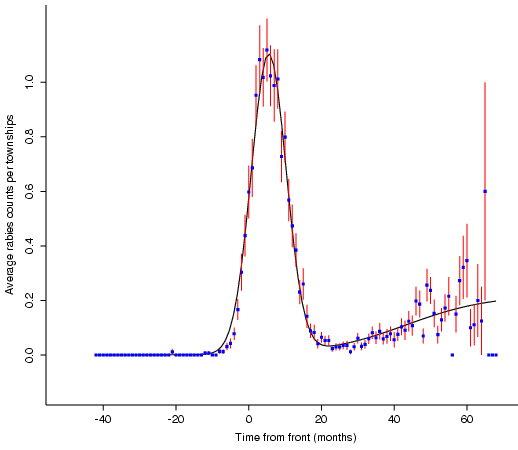
Model Fit to Local Spread
The mathematician cannot gaze upon such a beautiful local response
without modelling it. I constructed the model with two components, which I
consider to represent the epizootic and enzootic phases. The first component
is a gaussian spike (the epizootic), representing the rapid spread and
resulting population crash; the second component is a sigmoidal function
(the enzootic), which is zero prior to the epizootic, then slowly grows to
an asymptotic constant value.
This function was chosen to represent the two phases of the disease: the
epizootic (the first gaussian component), as well as the enzootic (the second
sigmoidal component). While this model does not have any known basis in the
underlying dynamics of the spread of rabies, it provides a convenient form for
summarizing the characteristics of the form. For the epizootic component,
-
alpha=1.098 is the average peak number of raccoons reported per month by a
town.
-
beta =.0217 is representative of the duration of the epizootic phase. For
it to fall to e^{-3} of its peak value requires 11.75 months, so the temporal
width of the epizootic is about 23.5 months.
-
t_1 =5.503 represents the shift from the original front until the peak of
the epizootic. If we take the 11.75 month figure from above, this would say
that our front equation is perhaps late by about 5.25 months: by the time a
case comes to the attention of officials, rabies has been established for about
5 months.
For the enzootic component,
-
gamma=.2210 is the asymptotic value of the rate of rabies reporting:
multiplied by 169 towns, we would expect about 37 cases per
month. The next several years of data should confirm or deny this. If the
model were correct, the conclusion is that the enzootic phase is not yet
established, but that the population of raccoons has not yet recovered to its
asymptotic form.
-
delta=.0867 represents the gradualness of the sigmoidal function: how
gradually does it attain its asymptote? This value of delta suggest that it
takes about 68 months to rise from 5% to 95% of its asymptotic value, or
around 6 years.
-
t_2=43.29 is the "center" of the sigmoid, the month of the inflection
point when the rise reaches a maximum and begins bending towards its asymptotic
value.

