- Reminder: stash your rectangles.
- I hope that everyone's gotten registered for IMath:
- In a browser, go to imath.nku.edu
- In the log-in box on the right side of the screen, click Register as a new student.
- Enter a username, password, name, and email address.
- In the Course ID box, enter 270.
- In the Enrollment Key box, enter 205s17
- Click Sign Up.
- Your first homework on IMath:
- By the end of today you should be able to finish your first homework set.
- It's due Friday.
- We'll have our first quiz today.
- Last time we defined the normal distribution as a symmetric and bell-shaped distribution,
and saw that it is completely determined by two parameters:
- $\mu$ -- which is the mean, or center, of the data.
- $\sigma$ -- which is the standard deviation, dictating the spread of the distribution.
- We also saw that the area under the bell is always 1 unit:
The area between the bell and the x-axis for every normal distribution would require exactly the same amount of ink to paint it.
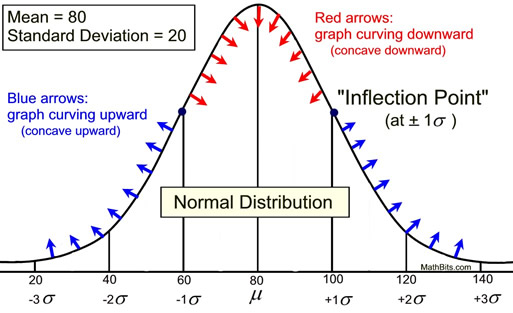
- Furthermore, we saw that one can see both $\mu$ and $\sigma$ from
the distribution:

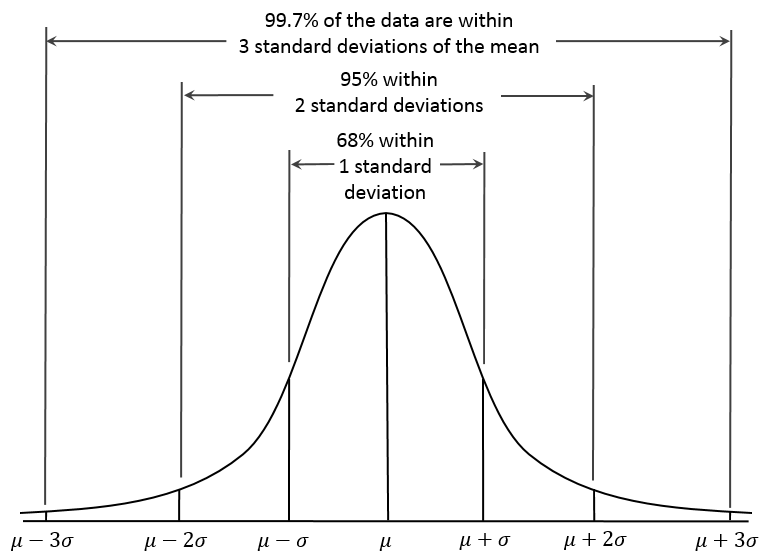
- The empirical rule gives us some rough idea of how much
area is found within certain "bands" (measured by standard
deviations $\sigma$) within the normal curve:
- We used the empirical rule to do some calculations. Now
we want to go beyond the empirical rule, and work with
any areas under the curve.
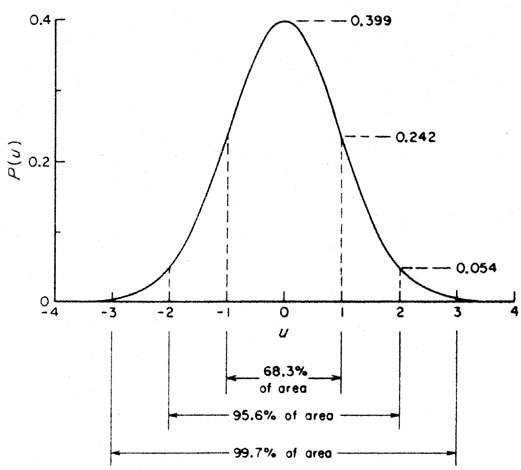
In order to do so, we switch to a "normalized" or "standardized" normal curve, which looks like this:

I like this graph: it's got about everything I want, only I wish that they'd used $z$ in place of $u$. We talk about $z$-scores, and think of $z$ as the value along the "$x$"-axis. So it's really the $z$-axis.
- The size of $z$ tells you how many standard deviations away you are from the mean.
- The sign of $z$ tells you whether you're to the left (-) or to the right (+) of the mean.
- Notice the heights: the inflection point occurs at about 60% of the peak height of about .4.
- The area between the curve and the $z$-axis is 1, of course.
- Notice how little area there is beyond $z=\pm{3}$. Not even one percent of the values occur more then three standard deviations away from the mean.


- If you don't have your Packet 1, just take out some paper and make notes that you can use to transfer to your packet when you DO get it printed out.
- Today we will need the Standard Normal Table of
probabilities: I hope that you have yours.
- At the end of the day we'll have our quiz.
- Video referenced in Packet 1.