- Reminder: stash your rectangles.
- I hope that everyone's started their homework in IMath, because it's due tomorrow.
- Your quizzes are returned. Let's glance at those.
- Here's a great representation of a normal:
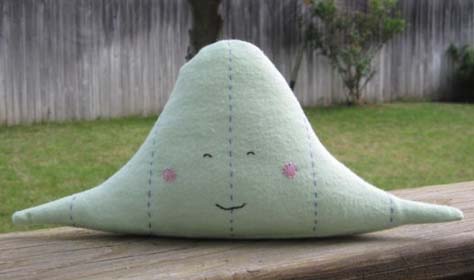
Take a look at your normal, and see if you did as well. By the way, that line that runs across the page was supposed to be the IQ-axis...!
- It's got the inflection point in the right place: where the first bands
of standard deviation occur ($\mu \pm \sigma$). It's important!
I can approximate the standard deviation in this graph pretty well: can you?
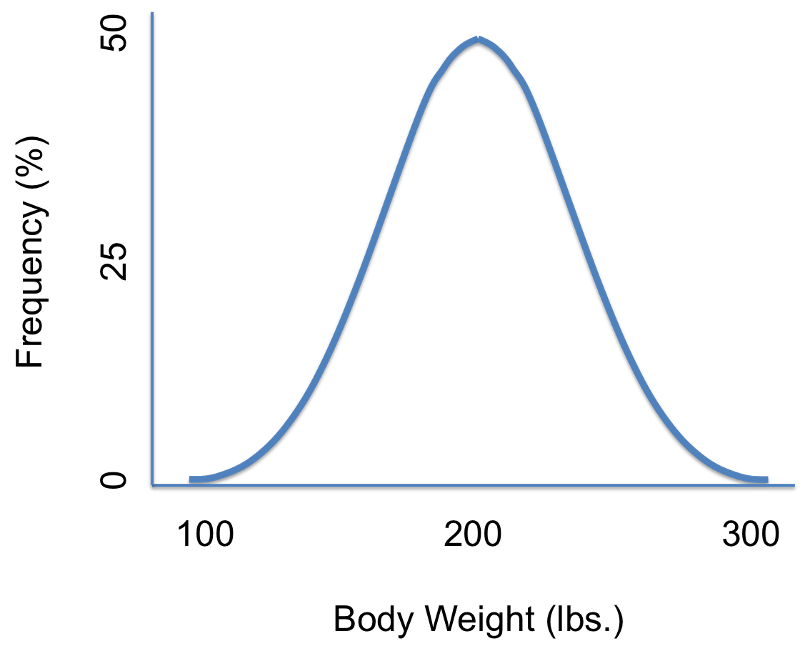
- It's also symmetric. Work on it.
- Finally, the tails peter off to nothing. That's the way your normal should look.

- It's got the inflection point in the right place: where the first bands
of standard deviation occur ($\mu \pm \sigma$). It's important!
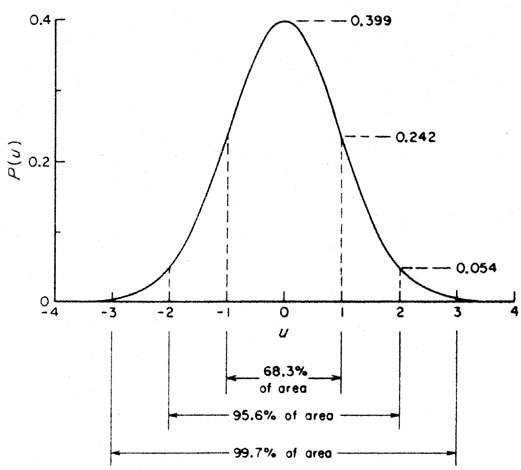
- For part two, you need the three bands, from right cheek to left elbow; and you can get them using the empirical rule.
- Here's a great representation of a normal:


- We're computing probabilities now, beyond the empirical rule, by
using the Standard Normal
Table:
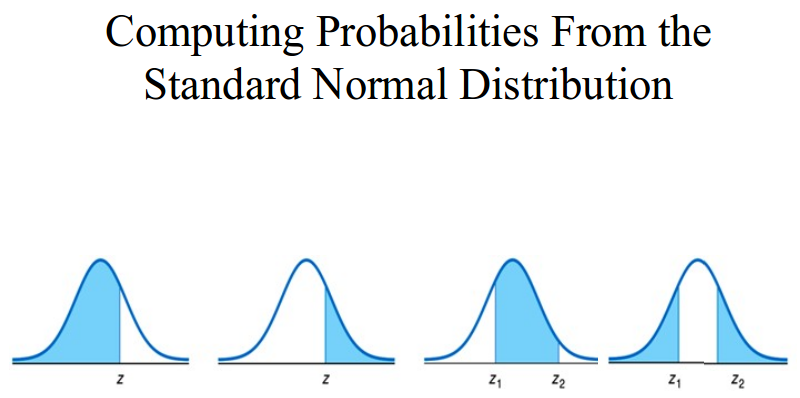
- We can compute any probability in the picture above:
- Given $z$, the area $A$ in the table is the answer.
- Given $z$, find the corresponding area $A$ in the table, and give $1-A$ as the answer.
- Given $z_1$ and $z_2$, find the areas $A_1$ and $A_2$ in the table. The answer is the difference in the areas (largest minus smallest): $A_2 - A_1$.
- This is just the sum of two areas of types 1 and 2 above.
- Now we're going to do it backwards: we ask, given a
certain probability (that is, given a certain area), what
value of $z$ corresponds to it?
Why would we want to do this? Suppose we want to know the age of Delta pilots for which 40% are younger and 60% older? We can find it, if we can use the table backwards.
- If you don't have your Packet, just take out some paper and make notes that you can use to transfer to your packet when you DO get it printed out.