- This just in: The math/stat lab is going on-line!
- Obviously things are going to be a little different going
forward. I'm sorry that this has happened, for lots of
reasons; but especially for the anxiety and fear that this has
caused.
Let us continue our work in this class, in order to maintain some sense of the normal (no pun intended!:).
- There have been a few changes to your syllabus. The new improved
version is here.
- Most importantly, we're going to be reducing the workload a
little. We've lost a week, and so we're winnowing down the
material (we have only four packets left). Check the assignments page to see exactly
how things have changed.
There has been no change in our exam schedule!
- Material will also be delivered a little differently, however. I
will still go over the packet, but you will have to put up with
my video presentations of our packets (if you wish): I will
continue to walk you through them. So that part will be a lot
like before, only I won't be able to joke around as much
without an audience...:)
I will be supplementing my own presentations of our packets with additional material provided by other instructors, who happened to have videos at the ready. You might check those out, in case they provide useful additional insights.
- You will continue to do assignments on Imath. In addition, we will
be having exams via Imath. These will be timed exams, to take
place during your usual class time. More on those as they
approach.
- I hope that you somehow managed to have a restful (in so far as
possible) spring break.
- Your quiz was graded, and I'll post a nice example of a quiz for
your perusal.
- All of your grades to this point are posted to Imath, and I used those to estimate your grade at midterm.
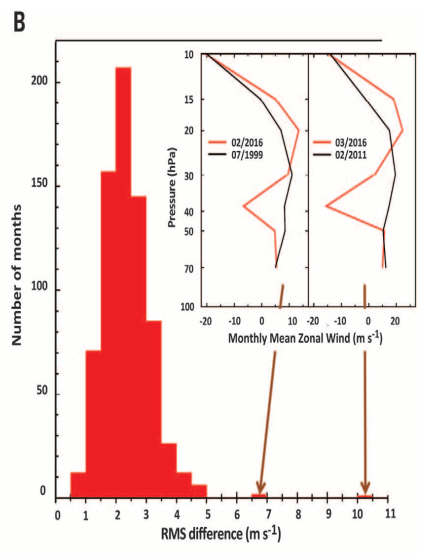
- A reminder of where we've been: here's a cool histogram

that I recently encountered in my research.
What is illustrated here is a couple of months that look nothing like the rest of the months. We might call them "outliers", but they are not errors: they are simply exceptional elements of the data set, which don't seem to "fit the data". To what extent would we be justified in "throwing them out" of the data set?
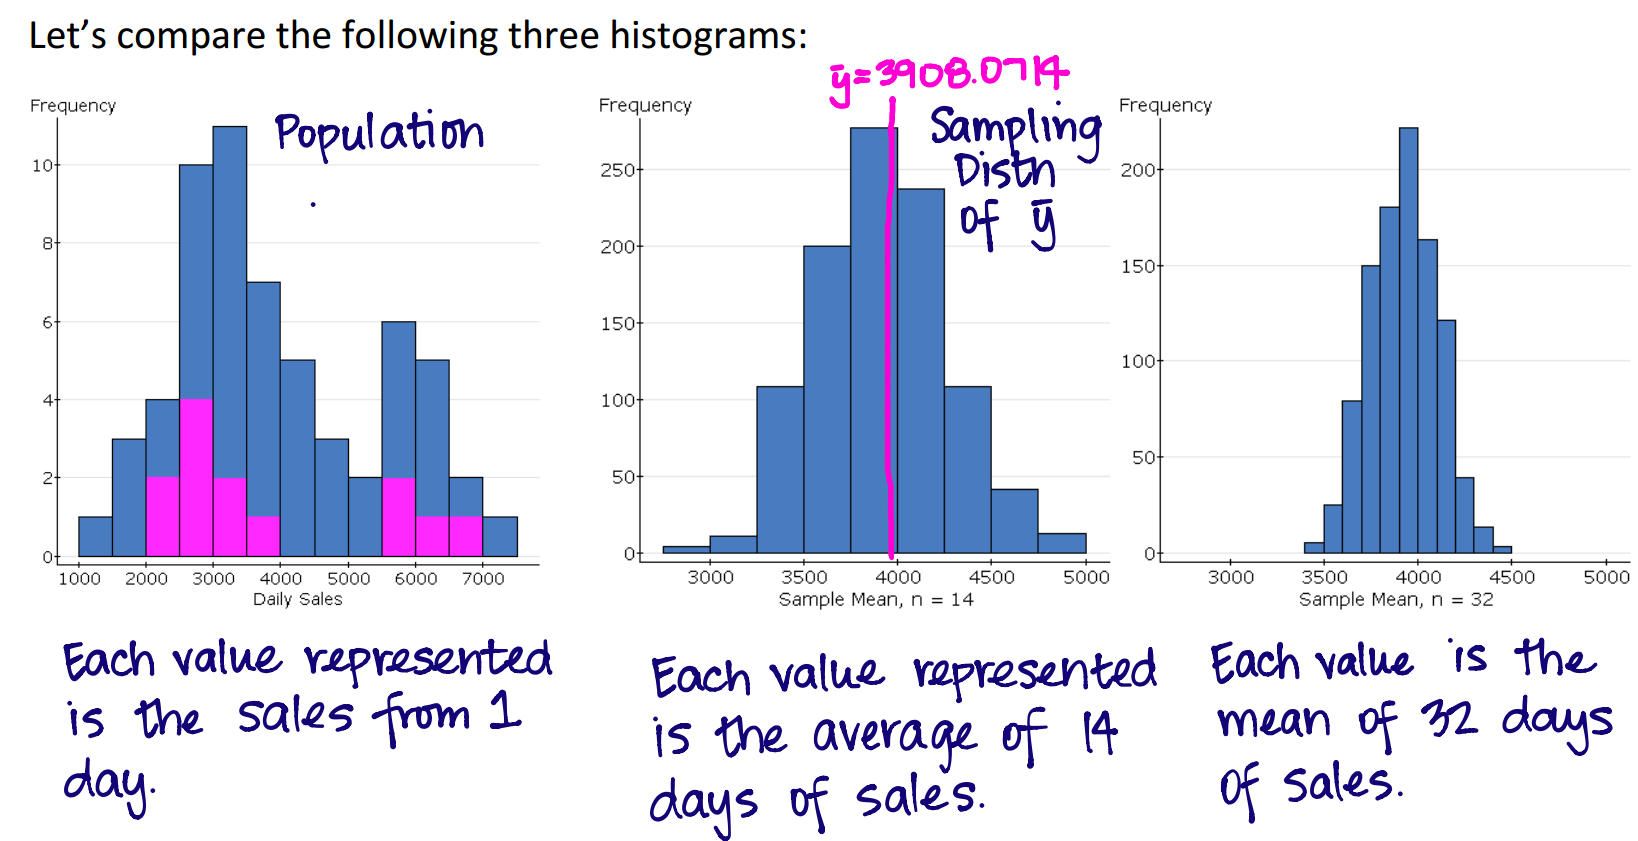
- Here's a nice figure to explain what we're up to in this packet
(from Brooke):

At left is the distribution of the population.
By taking samples of multiple variable values, and turning them into sample means, the original distribution (at left, which was far from normal) morphs into a more normal distribution for the means, tucked about the population mean of the original variable.
Furthermore, the standard deviation of the sample means decreases with increasing sample size.
So one of the important points is that we're back to dealing with normals, if we're willing to work with sample means taken from sufficiently large samples.
- With that as a preview, let's get started with Packet 8: Sampling Distribution
of the Sample Mean.
Sorry about the horrible audio in the following. This should improve when I move to the iPad for recording, but it will be a little harder to mark up the pdfs. Trade-offs....
I've prepared a video summary of the final filled-in packet, if you can't stand to go through the intro and examples with me....
- The Standard Normal Table of probabilities.
- Computing chi-squares in Statcrunch is carried out using the
Stat -> Tables -> Contingency ->
(then either data or summary, depending on what you have)