Storage is a huge issue, as the data files tend to be huge! Compressing the data is possible, but then it is not so accessible for the analysis step. Most GIS keep their data in some proprietary, compressed format so that it can be seemlessly used but won't take up a lot of space.
As you download spatial data, you may need to be very cautious so as not to overload your storage. Keeping your own files compressed when you're not using them is a sensible step, and every operating system has tools (e.g. gzip, WinZip, PKZip, CompactPro, etc.) to help.
``GIS use in public health is in a formative stage. The growing need for reliable environmental geospatial databases is a fundamental concern. Accurate and statistically representative locational information along with standardized quality-controlled measurements of environmental exposures, over time, are essential ingredients necessary to perform robust spatial statistical analyses of supspected associations between the environment and human and animal diseases.'' [1], p. 1963
- Where do we get data?
Spatial data gathering agencies (governmental) are a great source of data. Some of it is on-line, for free, and other data is for sale. Finding the data is a bit of a hunt: I find a lot by dumb luck, by window shopping web sites. Even when you stumble upon data, sometimes you can't tell what it is (as you may have discovered in the lab associated with the first module).
-
USGS, providing
elevation, land use/land cover, area boundary
information for the U.S.
- EPA,
providing information on toxic exposures
-
NCI providing
Cancer Mortality Data for the U.S., and its parent
the NIH
-
NOAA, providing weather information, including
precipitation, ozone info, ....
- CDC,
providing mortality and disease information and data
-
Census, providing census variables such as
population, age structure, etc.
-
NASA, providing
satellite imagery
- All branches of the Military, and
the CIA
We also get data from businesses, which are anxious to sell you all kinds of stuff. For example, we have paid for Census data (CensusCD), so that we don't need to do all the downloading and data massaging that you will have to do in this course!
-
USGS, providing
elevation, land use/land cover, area boundary
information for the U.S.
- How is data distributed?
Data is usually distributed in ``Headache format'': it is distributed in so many different spatial data file formats, that dealing with it is bound to lead to many different headaches:
-
One headache is the can't-get-from-here-to-there
headache, when your data is in one format and you
need it in another format to import it into your
software;
-
another headache is the
my-map-projection-is-different-from-your-map-projection
coordinate-conformity headache
(e.g. you use UTM coordinates, while someone else uses
lat/longs).

Here are the more traditional kinds of formats you will find:
- ASCII: csv, for example, as we saw in our lab last week. ASCII text is composed of the characters that you see on your keyboard (along with a very few others, notably the control character combinations).
- USGS data
are served in DEM, DLG, and SDTS formats:
- DEM (Digital Elevation Models);
- DLG (Digital Line Graph); and
- SDTS (Spatial Data Transfer Standard) - the new standard, to which the other forms are migrating.
- Census Data in csv, for example, (ASCII, comma
separated values) or TIGER
(Topographically Integrated Geographic Encoding and Reference)
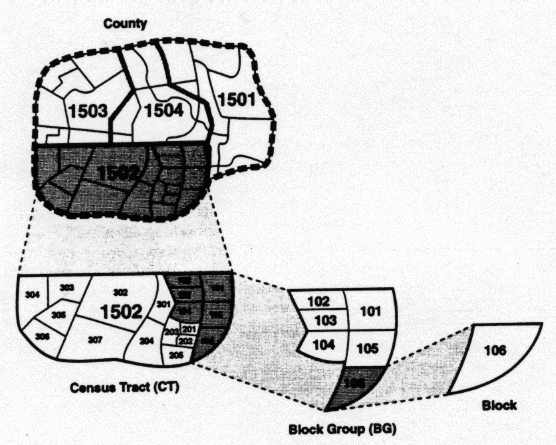
format. Census data is organized along these lines (in order of decreasing
area):
- States (identified by a
two-digit FIPS - Federal Information Processing
Standards - code)
- Counties (identified by a five
digit FIPS code, which is a three digit county
code appended to the the state code)
- Census Tracts/BNAs
- Block Groups
- Blocks

- States (identified by a
two-digit FIPS - Federal Information Processing
Standards - code)
- TIN (Triangulated Irregular Network) -
this is a file containing interpolated surface data,
often generated from a point file.
- images formats: tiff, gif, jpg (we've
already seen how to do some handling of these formats,
in the first lab).
- propriety data formats: bna, mif, shp,
e00, dbf, xls, etc.
-
One headache is the can't-get-from-here-to-there
headache, when your data is in one format and you
need it in another format to import it into your
software;
- Spatial data is sometimes created:
- by digitizing maps:
- by hand/mouse
- with special scanning software
- with a digitizing tablet
- Data is also created via Geocoding, or
georeferencing,
- from a data base (address-matching), or
- directly, via GPS (the Global Positioning System of Satellites)
``Differential GPS is now being used to relay satellite signals in order to ground reference the location of contaminated drinking and standing water sources associated with Guinea Worm and malaria endemicity, in African villages...''[1]
- Using remote sensing (e.g. Dr. Olson's
work at the University of Michigan: his class
in the School of Natural Resources mapped
Dexter township land use from aerial views
taken from small planes).
For example, satellite images may serve as surrogates of exposure or risk, as Croner, et al. report in our reading[1]: ``In Lyme disease aetiology, for example, forested areas on well drained loam soils appear as highly correlated habitats for vector Ixodid ticks and host white-tailed deer. Here, satellite-imaged information brought into a GIS contributes to the small area identification of significant elevated environmental risks of human exposure to Lyme borreliosis disease.''
- Data may be created from analyses
performed within the GIS or other software.
- by digitizing maps:
- Data Quality
The question of data quality has proven to be a hot topic in recent years, perhaps long overdue. It is not enough to have data, but you must be able to say
- how, where, and why it was obtained,
- who obtained it,
- how much error it contains, etc.
This becomes increasingly important as data becomes derivative, deriving from other data. If I create data based on your data, I compound any errors your data has with errors of my own, and so on. We seek to limit and quantify this error as much as possible.
Government agencies are doing better about documenting their data, creating data about their data (called meta data). This is because they have been mandated to do so (by President Clinton's Executive Order 12906, of April 1994: Coordinating Geographic Data Acquisition and Access: The National Spatial Data Infrastructure) [1]. This order requires
- establishment of a geospatial data clearinghouse;
- standardization of documentation of data sets;
- improvement of public access to data; and
- federal agencies to use the clearinghouse before collecting new data of their own with taxpayers' money.
Others, under less pressure, have not responded so well. For example, how many of you who have done the lab associated with the first module paid any attention to my plea that you collect meta data on the data you downloaded? At the very least keep track of where you got your data, so that you can perhaps go back there when the time comes for questions. (I say ``perhaps" because web sites come and go - you may discover that your source has dried up, or is now charging exhorbitant sums for what they used to give for free....)
Spatial data can be organized into three types:
- raster (raster GIS - e.g. GRASS)
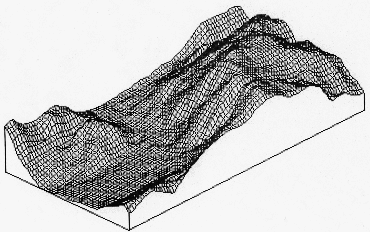
Raster data can be thought of as a matrix, a spread sheet, or data on a regular grid. An image, for example, would be raster data; so would an interpolation surface created from a file of scattered data, such as the one below:

- vector (vector GIS - e.g. ArcView)
Vector data is a combination of points (or nodes), lines, and areas (or polygons), as we see in the figure below. It is used to represent voting districts, rivers, roads, etc. (e.g. the county outlines in the Illinois slide).

- site
Site data is point data - data so small in relation to the area under consideration that it may be treated as a point. Thus site data is made up of geographical coordinates of point locations and attribute information about those points. For example, wells, gas stations, etc.
This depends on scale, of course, for on a world map cities would likely be given as site data (point locations) rather than as vector maps with spatial extent. There's no point in plotting a vector map when the result ends up looking like a point!
