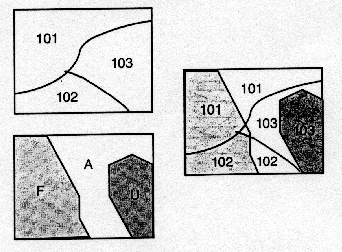
Overlays of ``themes'' provide the visual, hypothesis-generating power of GIS: you see your data in relation to the nuclear power plants in the area; to the rivers and streams in the neighborhood:

By adding these themes together, we create new themes. Alternatively we can take intersections of themes to create new ones.
GIS is perhaps most often used to measure. Distances from homes to rivers, from home to home, from road to road, etc.: GIS excels at this problem.
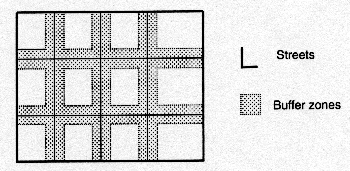
Buffering is a type of measurement problem.
For example, someone recently discovered that ``No place in the continental U.S. is more than 20 miles from a road." (which became the subject of a report on NPR, 12/08/98).

By creating 20-mile buffer zones around all the roads in the U.S., we should see that the entire continental U.S. is covered - that no speck of the country is left which falls outside of the areas created by buffering this line data.
To give an example closer to home, Dr. Jerome Nriagu of the Department of Environmental and Industrial Health at the University of Michigan is looking at the interaction between asthma and traffic in Detroit: for that, we need vector maps of the residential areas, roads, etc., which should then be buffered by traffic (size and type) volume.
Spatial averages/integrals are easily computed, so we can ask questions like this: "Given the raster map of nitrates produced over the State of Arizona, what is the average by county?" The GIS checks each polygon representing a county and adds up the pixel values of the raster map which overlay the county, taking an average at the end to give the desired result.
Queries are often used to form new maps, much like map algebra. They may be used to subset data (for example, from a map of all counties in the US, give me just the counties of Illinois). We'll see how to do that using ArcView in the lab associated with this module.
For example, you might
-
create a raster map from a nitrate pollution point map, where
the nitrate pollution is higher pollution is higher than
Federal levels permit.
- use map algebra to combine several raster maps of exposures, weighted by a regression relationship previously discovered, thereby creating a map of disease risk.
Often a mere picture is enough to allow us to infer the presence or absence of spatial autocorrelation (e.g. Buffalo graphs from Practical Handbook of Spatial Statistics or Spatial Autocorrelation - A Primer). Beyond the visualization analysis, however, GIS has been slow to go.
ESRI sells add-on products to ArcView such as ``Spatial Analyst'' to help users meet spatial analytical needs. This is the toolbox approach, wherein the GIS is the box and tools are purchased as necessary to complement the native features of the GIS.
Users of ArcView have begun to provide so-called extensions, which allow users to perform analyses. For example, we'll be using ArcView extensions provided by Dan Griffith and Luc Anselin, two of the consultants to the GeoMed Project, during the course. As time goes on, ESRI and other makers of GIS will surely be incorporating more and more spatial analysis options into their products.
Hydrological modelling (for example, see this slide from the grabber) has long been done in GIS, but to date not much has been done in the way of epidemiological modelling. We'll try to help rectify that!
