


Next: Conclusions
Up: Mapping Groundwater Pollution
Previous: Variogram Analysis
-
Drought conditions prevailed in the late 70's, while there was some flushing in the mid 80's, and more in the late period.
-
Agricultural land is being steadily replaced by residential and commercial property.
-
Because the earlier map contained far greater detail than the later map, we combined various land uses to make maps with commensurate categories.
-
Comparisons were made for these land-use types: residential, commercial, and industrial use; cropland and pastureland; orchards and groves; feedlots and dairies (cattle); and brush and scrub rangeland.
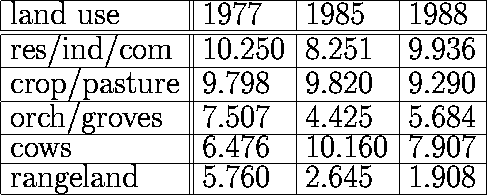
Table 1: Average nitrate values, by landuse, using cokriged maps
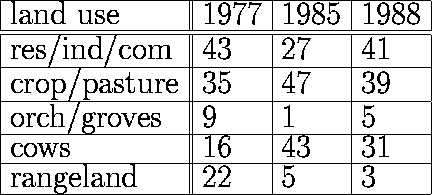
Table 2: Percentage exceeding 10 ppm
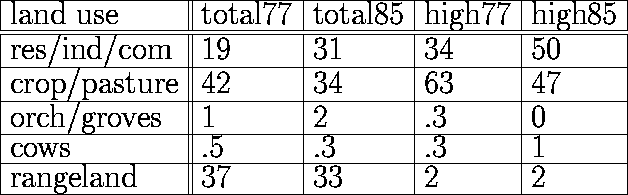
Table 3: Percentage of representation, versus percentage of high representation
Andrew E Long
Mon Apr 12 12:50:14 EDT 1999