- Sorry, I haven't had a chance to look at the homework yet.
- You do have another one due tomorrow.
- How was the Sehnert banquet/lecture? A few of you were there....
- Matthew and Chris L. were at the lunchtime talk...
- Tomorrow we'll move away from parametric and polar curves, into the land of sequences. Please read ahead, into Section 11.1.
If you look over the pictures in this section, you will see that there are many beautiful curves that one can create using polar coordinates and polar plots.
See, for example, p. 685 -- which should remind you of a spirograph, if any of you are that old....
The polar coordinate system was introduced by Newton, an alternative to
the Cartesian coordinate system. In the polar coordinate system every point in
the plane is expressed by its distance and direction (angle) from the origin
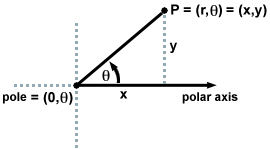
(called the pole). The polar axis plays the role formerly played
by the positive x-axis. The polar
coordinates are often given as , where
- r is the distance from the pole (although we may allow r to be negative), and
-
is the angle between the polar axis and the ray passing through the point of interest.
Here it is:

We represent the point P in one of two ways -- in rectangular
coordinates (x,y), or in polar coordinates . We can represent any point of
the plane in either of those ways. Note, however, that we have a certain level
of redundancy in the polar coordinate system.
Look at the origin, for example.
We allow r to be negative, too, which leads to further
redundancy. Furthermore, we think of as an angle, and the plane is
obviously then represented in a
-periodic way.
So now curves are given in terms of r and rather than x and y,
via
- #1, p. 686
- #3
- #10
- #16
- #27
- #67
- #47
- #56
- #64
Let's start with a circle of radius r, centered at the origin, and see how we might adapt the "familiar formulas" to more exotic shapes:


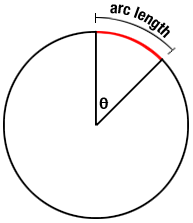
- Length: The arc length of a sector of the circle swept out
by angle
is given by
(with the familiar circumference formula being the case of sweeping out an angle of
.
So a small (infinitesimal) change
would sweep out a length of
.
- Area: The area of the sector is basically that of a half rectangle. Let's compute its dimensions.
- #1, p. 692
- 5
- 7
- 15
- 26
- 30
- 40
- 47
- 54