- Reminder: turn off your rectangles.
- You have a new assignment (due next Wednesday -- because of the Labor Day holiday).
- You do have an assignment due this Friday.
- The Math & Stat Lab in MEP 457 is open for business as of this
morning. The hours for the lab are
- Monday-Thursday 9:00am-3:00pm
- Friday 9:00am-12:00pm
- Last time we were using the tangent line (and secant line) to help
us to find roots:
Today we're more interested in the slope of the tangent line, because it tells us something about the rate of change of a function.
- Gil Strang is one of the most important modern living
mathematicians, and here's his "Central Idea of Calculus":
The velocity part is the derivative; the total distance part is the integral. In this course, we're focused on derivatives, hence the velocity. In particular, we speak of "instantaneous velocity" -- the velocity at a single point in time.
The velocity is a rate of change: for a car in the US it's usually given in mph (miles per hour) -- that's the rate of change of your car's position with repect to time at a given moment.
That's what your speedometer is showing (or at least estimating).
By the way, you can check out Gil Strang's "Highlights of Calculus" from MIT on-line. One of my students thought they were the best thing ever for calculus, and he might be right.
- The instantaneous velocity is a curious idea: how fast
are we going at exactly this moment? Here's a graph of one of
Usain Bolt's 100 meter races from 2008:
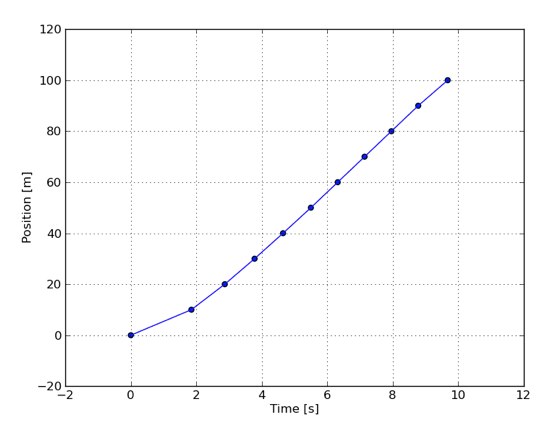
A race usually concludes with a time, but we can turn it into an average velocity, instead: Bolt ran at an average rate of about
$\frac{100m}{9.8s}=10.02\frac{m}{s}$ Do you really think that there are corners in his progress (e.g. at 2 seconds)? We don't believe that -- we just don't have data at every moment -- the more data we have, the smoother this graph will look.
In calculus we talk about limits: we'd like to have an unlimited supply of data -- data at every moment -- but that would be an infinite amount of data to plot, which would take infinitely long -- and we're just not that patient.
So we try to predict that the graph would look like "in the limit", where the difference between data values goes to zero. The limiting difference becomes "infinitesimally small"; becomes zero, essentially.
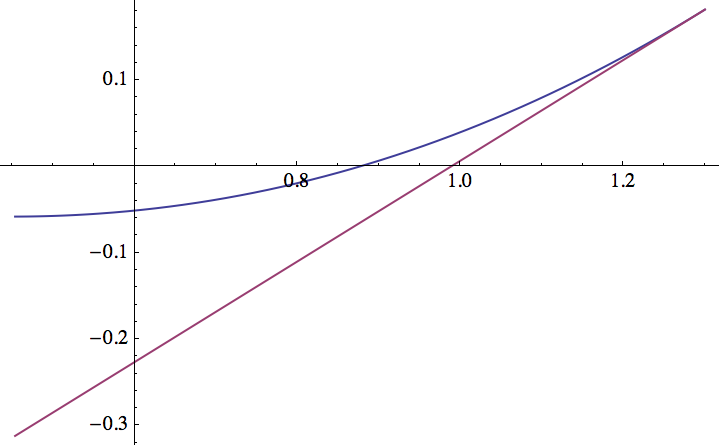
- Why are we concerned with "limits"? This slide
show illustrates the approach of the secant lines to the tangent
line for a smooth curve. It's one of the first important problems
we'll want to address in calculus. It's why we're interested in
limits of things at the outset.
Notice the focus on linear functions: linear functions are the most important functions in calculus.
- Let's look at some examples from 1.4, using Mathematica. We'll be
using Mathematica extensively in this class, so the sooner you get your
copy, the better!
