- Reminder: please keep the phones out of sight and sound.
- Two things today:
- Major/Minor lunch: " Please drop-by for lunch between 11:30 and 1:30 in the center atrium. On the menu this week, we have chicken tenders, mac & cheese, chips, and dessert."
- Colloquim: Dr. Pamela Pyzza, Ohio Wesleyan University, will be joining us on Friday at 1pm -- right after lunch! She will be giving a talk entitled Models of Insect Olfaction in MEP 461.
- Your regression homework is returned --
- When I said "by hand" I meant for you to use a
calculator, but to show your work.
- For the exam, which is coming up eventually,
you'll be expected to understand regression,
and regression diagnostics. I may well ask you
to do the essential calculations -- and know,
in particular, this very interesting and
important fact: that
The regression line must pass through the center of mass of the data. - If you didn't do the homework, please submit it anyway. I'll take something off, but it's better than a 0....
- When I said "by hand" I meant for you to use a
calculator, but to show your work.
- Please submit your addendum to your reports for Dave: all
the markings missing from Dave's stick for a 10 foot
log, obtained using a stated equation.
In the original problem I said that you should be able to reproduce any mark on the stick -- I hope that you know how!
- You have an assignment for Monday: I need you to
evaluate yourselves and your groups for the Dave
project. See the assignment page for
details.
- Here's my report for
Dave. Please take a look, and ask any questions or
make any comments before I pass it along.
Please read it over, and compare it to your own reports. I intend for these "final reports" to be models which you might follow in your own reports (with a few snarky remarks thrown in sometimes, because these two, in particular, were written for family/friends!:).
- We demonstrated that the linear algebra formulation of the
regression equations was generalizable, fitting a quadratic to the
Keeling data with just a few tweaks to the
linear fit code
- At the end of that Mathematica file is a set of
diagnostics. We started to discuss those, with the goal of
verifying that the linear algebra calculations will help us to
generate the Regression Diagnostics: Polya's "evaluate"
step.
- I gave you a handout, regarding Graphical check of Fit and
Residuals - is there a pattern to the residuals? If so, we go back
to the model-building step....
- Then we began the process of deriving the diagnostic $R^2$: how
much variation does my model explain?
- We break variance down into two parts: a fraction due to the model, and a fraction due to the residual.
- We'll finish the $R^2$ derivation.
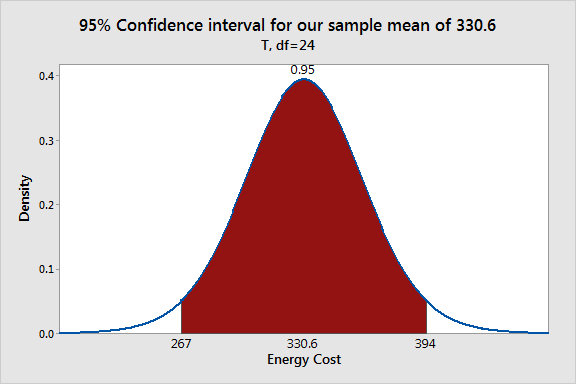
- Talk about confidence intervals for parameters: we provide
a box, rather than a single value.
- Often these are expressed in one of two
formats: with 95% confidence,
$a \in [338.0726177785132, 340.06679398619235]$ or
$a = 339.07 \pm 0.997088$ (these were the values of $a$ from the quadratic model to Stewart's Keeling data).
- Confidence intervals are related to p-values, but perhaps
more informative).
- The standard errors of the parameters pop out of the inverse
matrix we compute, multiplied by the mean SSE. Once we have those,
we have everything we need for confidence intervals.
We're often interested to know whether we can exclude a certain value from a confidence interval -- e.g., can we conclude that the slope parameter $b$ in a linear regression $y(x)=a+bx$ is not 0? If so, we conclude that there is a non-zero slope, and the model suggests that $x$ drives values up or down, depending on the sign of $b$.
- Let's check out my discussion of the regressions in the report for
Dave.
$R^2$ is ridiculously high in this case, because we know the function generating the marks on the stick. The errors -- the residuals -- are simply rounding errors, to the nearest board foot. Check out the graphs of data and model....
- Often these are expressed in one of two
formats: with 95% confidence,
- Eventually we may compare models, using statistics
such as anova, AIC, BIC, etc. For now, we're going to focus on
diagnostics pertaining to a single model.

All of these pop out of the model we obtain via linear algebra. - For our next trick, we want to talk about transformations of the
data that allow us to use linear regression. We've already seen one:
- if
one does a log-log transformation of both $x$ and $y$, and the data
look linear, then you'll be expecting a power model: $y=\alpha x^\beta$.
- If you log-transform only the $y$, and get a linear looking cloud,
then you'll be looking for an exponential model: $y=\alpha e^{b x}$.
So I've asked you for an exponential model for CO2. You log-transform the trend data, and plot. Then linear regress, if appropriate.
For the sinusoidal part, let's write out the model and see what we need to do....
- if
one does a log-log transformation of both $x$ and $y$, and the data
look linear, then you'll be expecting a power model: $y=\alpha x^\beta$.
- "The IPCC stands by its equation of 450 ppm = 2 degrees C [of warming]....": For years scientists have said that if atmospheric levels of carbon dioxide reach 450 parts per million (ppm) the planet would heat up by an average of 2 degrees Celsius above pre-industrial levels. They have also said that if the world crosses that threshold, ecosystems worldwide would suffer serious damage.