Ripley's K function
|
|
|
|
Indications/Recommendations for use: Ripley's K function is used to
compare a point pattern with point patterns generated by known processes,
e.g. a homogenous Poisson process.
|
|
Description:
A K function provides a summary of spatial dependence over a wide range of
scales of pattern, including all
event-event distances, not just the nearest neighbor
distances. Additionally, the theoretical form of the function is
known for various possible spatial point process models. Therefore, the
function can not only be used to
explore spatial dependence, but also to suggest specific models to represent
it and to estimate the parameters of
such models. (More)
|
|
Test statistic: Ripley's K (or L) function:
|
|
|
Null Hypothesis:
That the K function does not vary significantly from the line y=x.
|
Ho:

|
|
Alternative Hypothesis:
That there are scales at which the K function varies significantly from
the line y=x.
|
Ha:

|
|
GeoMed Inputs:
A point file (here's an example), composed of
three columns: x, y, and status (ignored by this analysis);
number of Monte Carlo simulations; spatial scale over which to calculate the
function.
|
|
GeoMed Outputs:
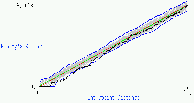
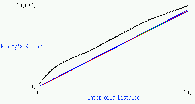
GeoMed gives a plot of the estimate of L(h) at different values of h, and
compares this to the line y=x expected under a homogenous Poisson
model. An envelope obtained from the max and min L(h) estimates of a
user-specified number of Monte Carlo simulations.
|
|
Example Analysis
|
Reference:
Bailey, T. C. and A. T. Gatrell. 1995.
Interactive spatial data analysis.
Longman Scientific & Technical. Essex, England; pp. 90-95, 103-5.
|


