- I seem to be missing two mini-projects:
- Kouma-Konda (#3), and
- Atakpame
- By Wednesday, I should have some general comments on your
mini-reports. I am going to ask you to help me to
evaluate them. More on that Friday.
- Your current homework assignment is to fit a
linear model (including oscillation) to the more detailed Keeling data (due
Friday). Details on the assignment page. This is a warm-up
for doing the same for a town in Togo.
I've just received the monthly rain measurements for each of the cities, too, which is exciting. Haven't even looked at them yet.
I'll be assigning groups and towns Friday, after we discuss the fit to the Keeling data in class.
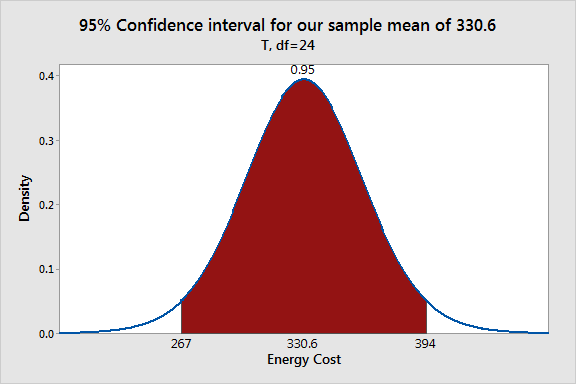
We too quickly finished off confidence intervals for parameters (essentially equivalent to p-values, but perhaps more informative).
The standard errors of the parameters pop out of the inverse matrix we compute, multiplied by the mean SSE. Once we have those, we have everything we need for confidence intervals.
We're often interested to know whether we can exclude a certain value from a confidence interval -- e.g., can we conclude that the slope parameter $b$ in a linear regression $y(x)=a+bx$ is not 0? If so, we conclude that there is a non-zero slope, and the model suggests that $x$ drives values up or down, depending on the sign of $b$.

All of these pop out of the model we obtain via linear algebra.
- Keeling data -- Patrick's exponential model
Patrick proposed an exponential model for the Keeling data, but it is non-linear in the parameters: \[ y(t)=ae^{bt} \]
Yet we can still use linear regression to fit it: how so? Start by using Mathematica's LinearModelFit to find linear models that fit Stewart's Keeling data.
- Construct an exponential model to the Keeling data. How do we compare the exponential and linear model?
- If we want to compare $R^2$ values, we can do so for the exponential model by using the formula we obtained in class: \[ R^2=\frac{SS_{Reg}}{SS_{Tot}}=\frac{\sum_{i=1}^n(\hat{y}-\overline{y})^2}{\sum_{i=1}^n(y_i-\overline{y})^2} \]
- How do we compare the exponential and quadratic model?
- Advertising
expenditures. This example is from Mooney and Swift's A
Course in Mathematical Modeling (p. 169). They suggest two
models for the data:
- Power model: $y(t)=at^b$
- Exponential model: $y(t)=ae^{bt}$
- How do they compare?
- What problem does the power model pose, relative
to starting value of time $t$? Does it change
if we represent years as 1970 rather than 70?
How do we interpret the power?
Does the exponential model suffer the same problem? What is the impact of a shift in time scale?
- Sea Anemone reaction
time (from Lamm's UMAP model)
- Duration of Response is a function of size (in "conventional units"!). How should it vary, do you think? What do you think from the scatterplot?
- Using Mathematica's LinearModelFit to find linear
models that fit Stewart's Keeling data
- An extract from Curve
Fitting via the Criterion of Least Squares, by John
Alexander. A bit old-fashioned, but it's got all the
major ideas, and some nice examples.
Alexander also illustrates that one cannot simply invert the regression equation $y=a+bx$ to get the regression equation $x=\frac{y-a}{b}$. So it really matters in linear regression which variable is considered "independent" and which is considered "dependent".
- My linear algebra derivation.