-
During class time I'll be on Zoom, at https://nku.zoom.us/j/7057440907.
- Sorry, I've not gotten your take-homes graded yet. I'll have them
by Friday.
- A few remarks about the exam, and plans for the final two weeks.
- I told you that I'd found the BG data, and wondered about
doing a few things:
- We can now check Fletcher's dates. I asked if you could
construct a new data set that has the years of
temperature extremes?
For each day of the year, we want to know which year
had the max max, the min max, etc.
That's an interesting exercise, which I carried out using "hash tables" -- one of the coolest data manipulation programming tricks I know.
- Then I asked if you could construct a model of the form
\[
\alpha + amp\ Sin[2\pi (t - phase)]
\]
for the maximum temperatures (where $t$ is in years), for the minimum
temperatures, and for DTR?
What if we add a linear term: \[ \alpha + \beta x + amp\ Sin[2\pi (t - phase)] \]
And reminded you that it's not just the values of the parameters, but also the significance of the parameters -- is it possible that they are zero? In which case we can drop that portion of model from consideration....
To evaluate the effectiveness of a model, it might pay to focus on the mean square residual: that seems a fairer metric for evaluating the difference between models (and one that I'd hoped you'd focus on during your exam -- I emphasized it by actually doing that calculation separately, even though it already figured in the tables of regression results).
- We can now check Fletcher's dates. I asked if you could
construct a new data set that has the years of
temperature extremes?
For each day of the year, we want to know which year
had the max max, the min max, etc.
- First of all, I had to update that BG data file that I put on-line
last time, because it had some missing data in it -- which caused us
trouble in the past (although you may now know how to deal with it). I
simply removed any date that had any missing data.
That's a little draconian -- sometimes we had a max, but no min (or vice versa). It would be better to keep what we have. But in the interest of moving along, I just eliminated anything missing one or the other. That's a fairly conservative strategy....
- So I went about finding the extreme years, as Fletcher did, but
using the data that NOAA has on file. I thought that it would certainly
be interesting to compare Fletcher's data with what we have on the
"official record".
- So data-wise,
- For historical purposes, here's the data as
it arrived from NOAA -- August, 1893 through April 14th,
2020.
One of the things you'll notice is that they used a variety of date strings, which might seem really strange -- except that I requested that NOAA give me all the data on Bowling Green from 1700-2020 -- so their server put together several data sets (I don't have the documentation for those, although I've sent an email off to NOAA to see if I can get some). So presumably, the different data sets used different systems.
That was one pain in assembling the data below -- creating a consistent format.
- I've got the latest and greatest BG data here (with some
missing values eliminated, and a few new variables that I
derived, not provided by NOAA -- e.g. years since 1/1/1893);
- my "Fletcher Years" data
obtained from this updated BG data -- giving the extreme
temperatures and extreme years (with repetitions) for each day
of the year;
- Combined Years
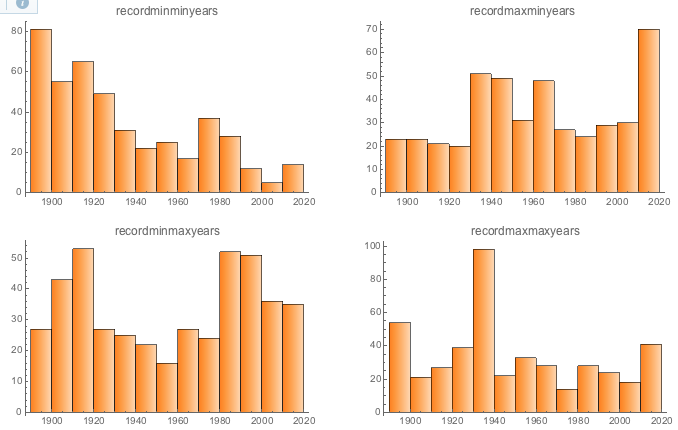
for each set of extreme data. Here's a picture of the updated
"Fletcher years", histograms by decade, based on that data:

Note: the first decade is truncated (1890-1900 -- since the data started in August of 1893).
What do you think of this, more modern version, of the Fletcher years?
How well does it jive with our original hypotheses, and what we have come to expect based on other people's work?
- For historical purposes, here's the data as
it arrived from NOAA -- August, 1893 through April 14th,
2020.
- So here's what I'd like you to do:
- check these Extreme year data values
against the original Fletcher data. Pick your favorite set of extremes (the most
sensible choice would be those you have already examined) and examine
the new data (comparing it to Fletcher's). There should be a lot of
overlap: if not, something may be really wrong. And who wants to do
analysis on incorrect data....
- Choosing either minimum or maximum temperature, create the
pair of models described above for that temperature as a
function of time, using BG data here
and the year-since-1893 variable as your time variable.
Reminder: although these are non-linear models, they can be linearized -- so you can use linear regression by splitting your trig term using a trig identity. Or just do the regression using a non-linear regression routine.
In terms of climate change, the most interesting parameter is the slope of the linear term: is it significantly different from 0?
- check these Extreme year data values
against the original Fletcher data. Pick your favorite set of extremes (the most
sensible choice would be those you have already examined) and examine
the new data (comparing it to Fletcher's). There should be a lot of
overlap: if not, something may be really wrong. And who wants to do
analysis on incorrect data....
- The Bestiary of functions, from Ben Bolker's Ecological Models and Data in R
- My "DEs in a Day" page.