-
During class time I'll be on Zoom, at
https://nku.zoom.us/j/7057440907.
- Your take-homes are graded, and on your drives. If you're still
having trouble accessing them, let me know. I'll send you the appropriate link.
Some comments:
- Average your in-class and take-home exams for your exam score.
- If you did your take-home in two files, you will have
scores on each part, which I averaged to get your
take-home score.
- There's a curve: add 5% to your score, after
averaging. That gets us mostly As and Bs.
- Problem 1: InsightMaker
- You were to give the details of the implementation
of Newton's method using the mechanics of
InsightMaker. I'm going to just provide Kate's solutions to the Take
home, and you can see roughly what I wanted for this
one.
I definitely want to see paragraphs in your solutions; you need to present a description, an argument, a suggestion, or something which shows that you've thought about the results (which most of you obtained and presented). So most of you did the "Carry out" part, but not as many of you really did the "Evaluate" part.
It's a moment to criticize; to gripe; to propose; to scratch your head; to be amazed, stunned, saddened, delighted, horrified, puzzled, ....
But it's definitely not a moment for silence.
- For the four functions, you were to explain why
you got the results you did. In some cases it's bad
luck (an unlucky starting point).
Sometimes it seemed like I was hearing the announcer telling me where the ball is, and who has the ball -- without telling why the pitcher released it, why the batter hit it with the wooden stick, why the fielder chased it, why the fielder threw it to second base, why the second baseman whacked the runner with it, and so on.
I wanted to hear it from the manager's perspective -- and you're the manager!
- You were to give the details of the implementation
of Newton's method using the mechanics of
InsightMaker. I'm going to just provide Kate's solutions to the Take
home, and you can see roughly what I wanted for this
one.
- Problem 2: Non-linear regression (Kate did a great job on this one)
- While many of you found the model and presented
the diagnostics, few of you really evaluated the
model. Many of you relied on $R^2$, which we saw is a
mistake (if you read the in-class portion key).
- When plotting residuals, use the original
$x$-values of the data points for plotting
them. Spacing is important. It tells us how evenly
spaced the data is, and so on.
- $\alpha$ is the horizontal asymptote -- but what does it mean in terms of the model, or the problem? It's the asymptotic velocity.
- While many of you found the model and presented
the diagnostics, few of you really evaluated the
model. Many of you relied on $R^2$, which we saw is a
mistake (if you read the in-class portion key).
- Average your in-class and take-home exams for your exam score.
- Take-home exam
- Take-home exam
non-linear model fit (Mathematica code)
- I introduced some new data (or ratherly newly derived from the BG
data):
- For historical purposes, here's the data as
it arrived from NOAA -- August, 1893 through April 14th,
2020.
- The latest and greatest BG data here (with some
missing values eliminated, and a few new variables that I
derived, not provided by NOAA -- e.g. years since 1/1/1893);
- my "Fletcher Years" data
obtained from this updated BG data -- giving the extreme
temperatures and extreme years (with repetitions) for each day
of the year;
- Combined Years for each set of extreme data.
- For historical purposes, here's the data as
it arrived from NOAA -- August, 1893 through April 14th,
2020.
- Then I gave you a task
- to help me check these Extreme year data values
against the original Fletcher data.
- And, choosing either minimum or maximum temperature, create the pair of models described above for that temperature as a function of time, using BG data here and the year-since-1893 variable as your time variable.
- to help me check these Extreme year data values
against the original Fletcher data.
- I've been plugging ahead with some ideas about Fletcher
data. Today I try to motivate your homework -- why do
we need to compute those models for max and min
temperatures? The key word is simulation.
One purpose of models (e.g. the enormous climate models that are used to guide policy on climate change) is to simulate conditions given certain inputs -- to predict the climate in 2050, or 2100, or however many years down the line. Often changes to parameters are made, then a simulation is run -- so we change the impact of cloud cover, or we introduce a new process (e.g. ocean circulation). Then we see how the predicted climate responds.
We can simulate Wood County weather, once we have a model for it, and then see if the distribution of extreme years matches up well with Fletcher's distribution. If we use a model with a linear trend over time, then we're saying "climate change"; if we use a model with no linear trend, then we're saying "no climate change".
I also describe the process of randomization, which is essential for generating weather. We want to generate 1000 "realizations" of Wood County weather, then see whether Fletcher's extreme year distribution is outlandish (or not), given an assumption of no climate change.
- So let's peer down one direction the Fletcher project is headed:
into simulation.
- Because we have the actual Wood County data from which
"The Fletcher Years" were derived (or something pretty
close, based on my initial impressions), we can deduce
some properties of the time series of temperatures (max
and min).
- While my initial thought for the project was to be able to
deduce something about climate change based solely on
the years at which extrema occur (and I think that we
have deduced something about climate change -- we've
rejected the hypothesis of no climate change), since we now
have the data on which Fletcher based his results, we might as
well use it.
The rejection of a null hypothesis of "no climate change" was based on a $\chi^2$ test for independence, between our results and those of a uniform distribution.
- Our hypothesized expectations were not met: we had assumed
that we would see more maxmaxes and maxmins in modern times;
and that we would see more minmaxes and minmins in earlier
times. And that is not borne out (at least not in entirety).
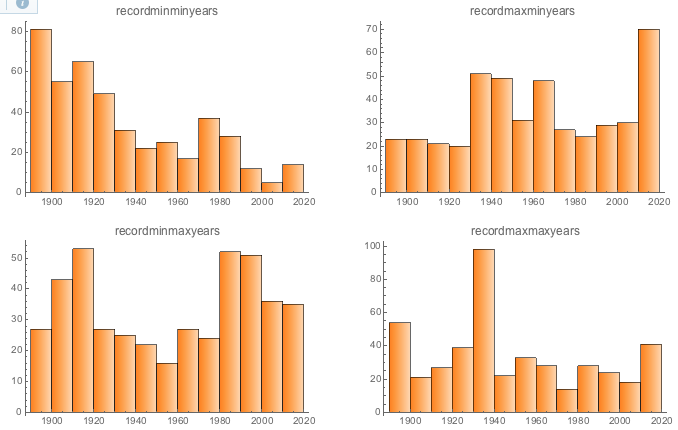
MinMins are really in line with our expectation; maxmins look like they're making a move in our direction; min maxes seem confused, and maxmax years have never gotten over the 1930s....
- As we have examined the issue further, we have discovered
that Diurnal Temperature Range is decreasing globally,
particularly over land, due in particular to the warmer nights
leading to increases in minima (which often occur at night).
We have checked our own data (using Custar), and seen that it appears to be happening in Wood County.
Meanwhile, in max land, increasing cloud cover over land may be supressing max temperatures, keeping them down.
- Having now obtained the Bowling Green data, we can
simulate the weather, and see what's the chance of
obtaining results as extreme as what Fletcher got (or more so)
given our model of the data.
So we simulate the weather, and see if the Fletcher results fall within a "95% confidence" envelope provided by the model.
- That's the idea.
- Because we have the actual Wood County data from which
"The Fletcher Years" were derived (or something pretty
close, based on my initial impressions), we can deduce
some properties of the time series of temperatures (max
and min).
- So, we need to simulate the weather of Wood County. How shall we
do this? (And, as I write this, I don't know the exact answer -- I'm
"thinking out loud" -- the clacking of my keyboard the only noise.)
If you want to simulate a normal distribution, you need to know the mean $\mu$ and the standard deviation $\sigma$, and away you go. Simulations of normals are based on chosing random numbers from a uniform distribution (which computers can do pretty well).
Computers are good at choosing uniform random numbers, but even you can do a good job at this, with just a (fair) coin. Here it is, in four easy steps:
- Flip the coin 100 times (so it's boring --
and that's why we leave this to computers!);
- If it's heads, record it as 1; otherwise 0. You're
writing a binary number (e.g. 1001 base 2 is 9 base 10
-- $1*2^3+0*2^2+0*2^1+1*2^0 = 9$).
- You can generate all numbers between 0 and
\[
2^{100}-1=1267650600228229401496703205376-1
\]
this way. In other words, you generate $2^{100}$
numbers in a row. Easier example to contemplate: If you
throw twice, you have $2^2$ possibilities: 00, 01, 10,
11 -- $2^2$ numbers between 0 and 3 (11 base 2 is 3
base 10).
- Your throw (call it $b$, for binary) is one of
them: divide $b$ by $2^{100}$ and you have a number
between 0 and 1.
I threw "1001101000001101001110110110001010000110100000100100111010011111010011010101011110011100011110000000" (okay, to be honest I let the computer throw that...), which is 762827007763806961434403391360 in base 10 (I let the computer do that, too -- I'm feeling a little sheepish about this whole thing now).
So my random number is 0.6017644038715926 (I even expected the computer to do the division -- you'd think that I could do something here, and division is something that I learned in elementary school....).
Once we have our sample size of uniform random numbers, we'll use those and the cumulative distribution for a normal (which runs from 0 to 1), and work backwards:
- For each random uniform $u_i$ from uniform
probability density function (pdf) U[0,1]
(which we got as described above), do:
- Solve $u_i=normalcdf(0,1,z_i)$ for $z_i$
(an inverse problem; you can solve that with Newton's method, for example: find $z$ such that $f(z)=u-normalCDF(0,1,z)=0$).
- Set $x_i = \mu + \sigma z_i$.
We now have a mathematical model for a sample from a random distribution.
- Flip the coin 100 times (so it's boring --
and that's why we leave this to computers!);
- Now, in our case, we're not trying to create normals, but weather
values. So how do we alter this strategy to let us simulate
weather? (That's the modeling problem we've got!)
So here's one approach:
- start by creating a distribution of mins (or maxes) for
each day of the year from the data: 1/1 through 12/31:
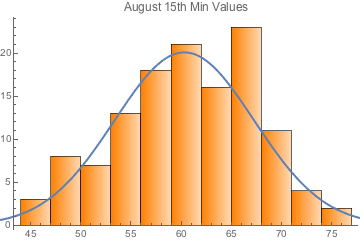
Empirical PDF -- Probability Density Function -- for August 15th Minima with a suggested normal-distribution overlay. Maybe the data isn't normal, but that's just to give you the idea.
We might want to create a theoretical distribution from the empirical data -- otherwise we'd never be able to exceed the extremes of the data (to "create new records").
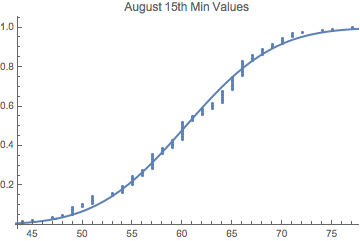
Empirical CDF -- Cumulative Distribution Function -- for August 15th Minima with a normal cdf overlay (I just used the mean and the standard deviation of the empirical data to estimate the normal). Maybe the data isn't normal, but this is just to give you the idea.
By the way, for the randomin
But one way or another we'd need a distribution to sample from.
-
Then we might start the simulation from August 1, 1893,
and pull minima (or maxima) at random from each day's
distribution, and do that right up to April of 2020.
- Then we could go back and find all the extreme years,
and create Fletcher-like year distributions, to compare
to the real one -- Fletcher's.
Then we address (and hopefully answer) the question: is Fletcher's result possible, given an assumption -- a null hypothesis -- of no climate change?
And all along I've been assuming the alternative hypothesis: "Nope!"
Well, actually, there's a problem with it. Weather is correlated, day by day:
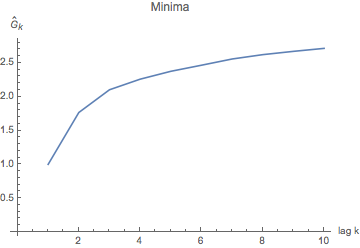
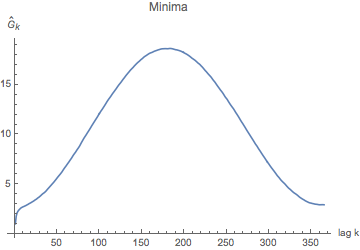
Variance of mins for days a given number of "lags" (days) apart (up to 10). This graph is really just the "nose" on the graph at right -- we zoom in on the first few lags, to see how the variance dives down for mins for days that are within a few days of each other. We think of a "lag" as a delay -- it means we're comparing days lagging by 1, by 2, by 3 days from each other, and so on (up to 10 days apart in this graph).
Variance for "lags" up to 365 days apart -- i.e. one year. You may all have heard that you can't trust a weather prediction more than about a week out, and what you're seeing here is a picture of why that is: you can't trust a day 7 days out more than you can a day a year later -- i.e., "what's it usually doing on April 24th?".
What this tells us is that tomorrow's temps are more similar (variance about 1 for minima one day apart) than those 10 days apart (variance 2.7 or so). The graph tells us the obvious: there's a lot of variance between temperatures a half year apart (you may have a winter min compared to a summer min); and that, since temperatures are essentially periodic, temperatures about a year later are also very similar. So what we notice is that, after about a week, the correlation between two mins a week apart is about the same as the correlation between two mins exactly a year apart. A year apart is really "seasonal correlation" (more "climatic", if you will); the correlation for mins just a few days apart is some weather system moving through.... Which has an effect of no more than about a week. - start by creating a distribution of mins (or maxes) for
each day of the year from the data: 1/1 through 12/31:
- So that's where I'm thinking that we go from here. But we need
those mean functions, which could be provided by your models for the
min/max data from Bowling Green. So get those models!
Also, be on the look-out for any outliers. Take a look at the data, to see if there are any funny looking data that we should investigate, too....
- The Bestiary of
functions, from Ben Bolker's Ecological
Models and Data in R
- Kate suggested that this site was useful for the non-linear regression problem on Exam 2.